OLAP - Online Analytical Processing
OLAP Cubes are flexible tables that allow users to add and remove data elements, as well as arrange those elements in different configurations.
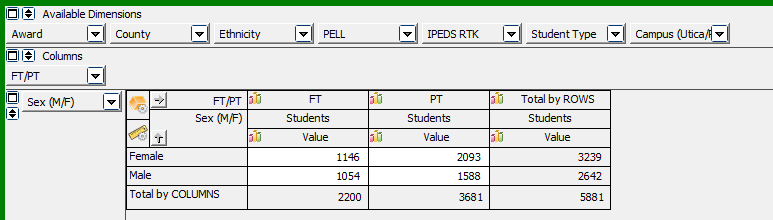
Here is an OLAP analyzing semester enrollment. There is a drop-down box to enter a term, a "Go" button to execute, and the cube itself, containing Dimensions (Award, Count, Ethnicity, etc.) and Measures, or values.

In the OLAP above we see that there were 784 female and 646 male students on the Rome Campus, with values as well for Utica and a Total column. Suppose you are more interested in enrollment by full/part-time status than by campus. Simply drag the Campus dimension from Columns to Available Dimensions and then drag FT/PT to Columns.
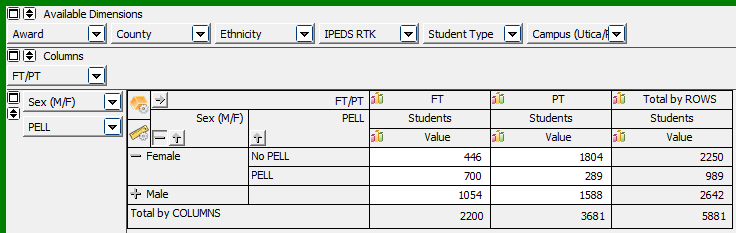
Furthermore, you would like to see how many full-time, female, PELL recipients were enrolled. Drag PELL below Sex (M/F) and click the plus sign near Female to see the answer - 700. Note that plus/minus signs may also appear in columns, seen in the next example.
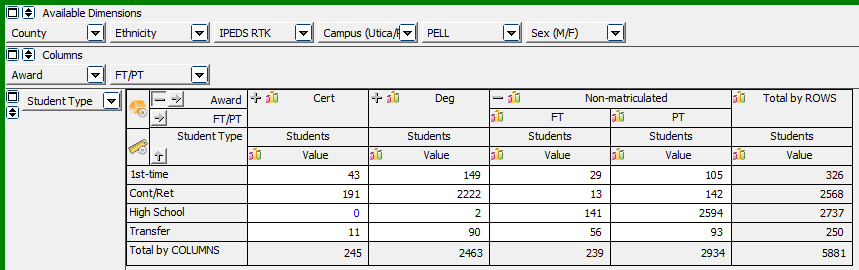
One last example - you want to see full-time, non-matriculated students by student type (1st-time, continuing/returning, transfer, and high school). Drag Student Type, Award, and FT/PT to rows and columns as in the figure below, then click the plus sign near Non-matriculated. Here is the result.
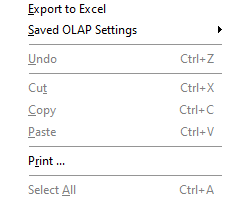
Exporting or printing the results is easy, just right click anywhere in the table to activate a menu, then make your selection.
Click OLAP Filters and Graphs for help with, well, filtering and graphing OLAPS.