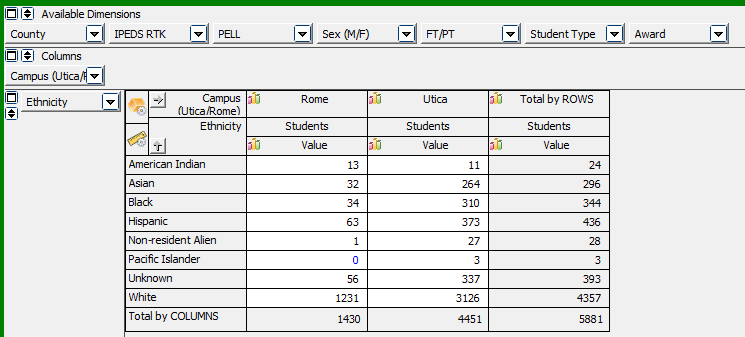
Let's see how many new students (1st-time and transfer) are enrolled on the Utica campus, by ethnicity. Drag Campus and Ethnicity to Columns and Rows, respectively.
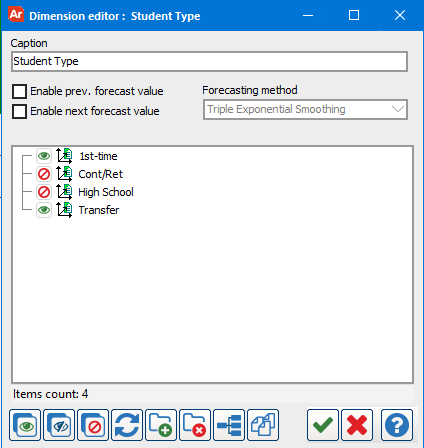
Click the arrow next to Student Type in Available Dimensions to activate the Dimension Editor. Double click Cont/Ret and High School (you'll see a red stop symbol) and then the green check mark at the bottom.
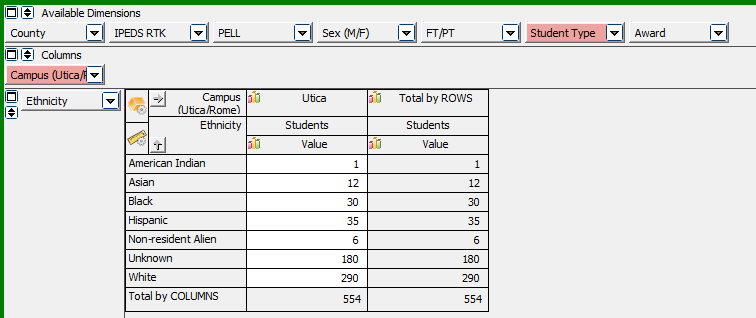
Do the same for Campus (Utica/Rome) to remove Rome. Notice that Student Type and Campus (Utica/Rome) have both turned red to indicate they are being filtered. Removing the filter is the same process.
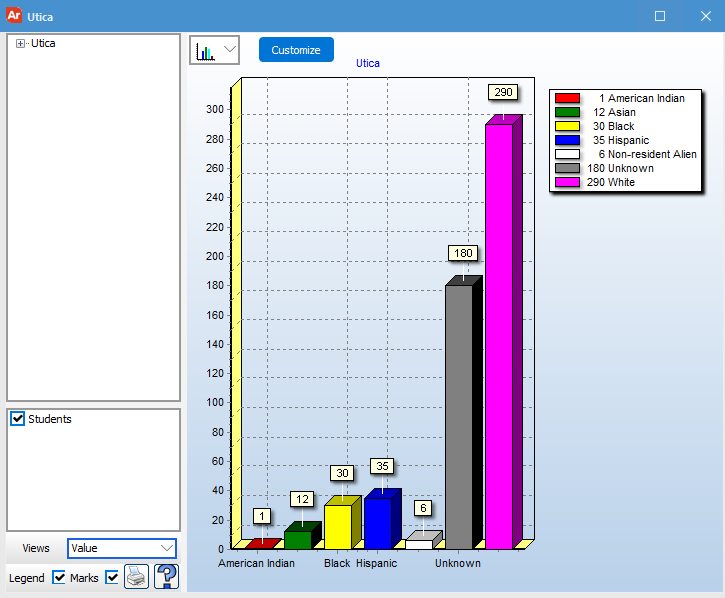
Right click in the table to print or download, but you can also make a graph by clicking the tiny graph next to Utica.